
GICT knowledge base
Using AI to Monitor and Auto-Heal Your Hosting Stack
Published
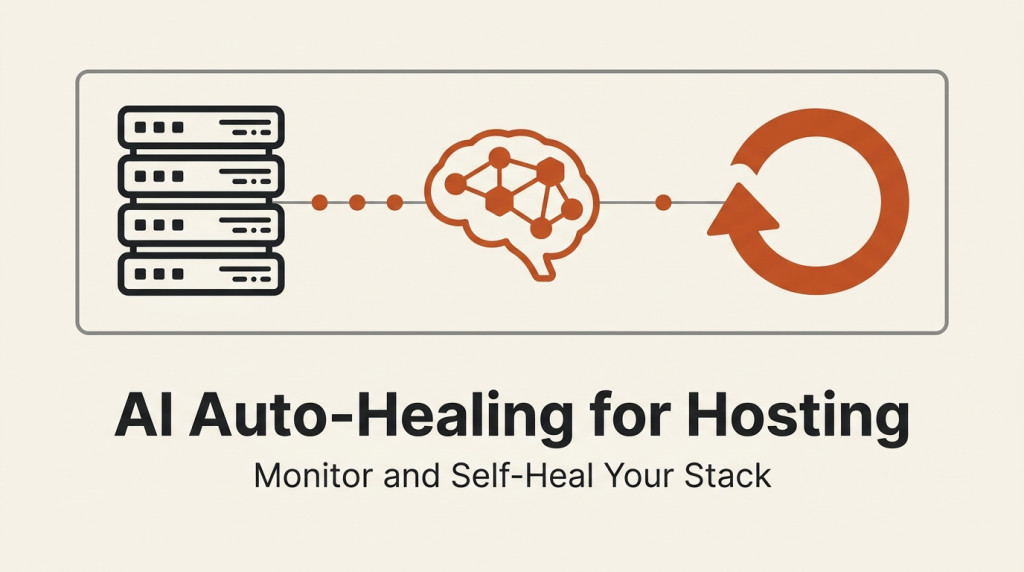
It is 3 AM. Your site goes down. The alert fires. You wake up, find your laptop, ssh in, restart a service, and go back to bed. This happens three times a month. Each time you fix it, you tell yourself you will automate it tomorrow.
Tomorrow never comes.
Most monitoring setups are still dumb. They compare a number to a threshold. CPU above 80 percent? Alert. Disk above 90 percent? Alert. It works for known problems. It fails completely at unknown problems.
That is what AI monitoring changes. Instead of comparing numbers to fixed rules, it learns what normal looks like for your specific stack, flags deviations from that normal, and – in the best case – fixes the problem before you even see the alert.
This is not futuristic. It is not expensive. The tooling is real and most of it is open source. Here is what it actually looks like in practice.
What “AI Monitoring” Actually Means
Three distinct ideas get bundled under this term.
1. Anomaly detection. Train a model on what your metrics normally look like (CPU, memory, requests per second, response times, error rates). When a metric drifts outside that learned “normal,” fire an alert. The threshold is dynamic and adapts to traffic patterns, not static like the old way.
2. Log pattern recognition. Train on log output to spot patterns that historically precede incidents. Memory leak signatures, slow query buildup, certificate expiry warnings – anything that has shown up in past incidents.
3. Auto-remediation. When something goes wrong, take a pre-approved action automatically. Restart a service, scale a replica, clear a cache, fail over to a backup. Most production-grade systems keep humans in the loop for risky actions but automate the safe ones.
None of this requires a GPU, a data scientist, or a six-figure vendor contract. It requires understanding which problems are safe to automate and starting there.
Why Threshold-Based Alerts Fail
Look at any traditional monitoring dashboard and you will see the pattern. Static thresholds everywhere. CPU above 80 percent, latency above 500 ms, error rate above 1 percent.
Here is why that breaks:
Daily patterns break static thresholds. Your site gets 10x traffic between 9 AM and 5 PM. CPU hitting 70 percent during business hours is normal. At 3 AM it is a problem. A static threshold cannot tell the difference.
Weekly patterns break them harder. Maybe Monday mornings spike. Maybe Friday afternoons drop. A model learns this. A threshold does not.
Cascading failures look like noise. When a backend service starts failing, you might see five different metrics drift at once. Threshold alerts fire five times in random order. An AI sees the pattern and reports one root cause.
Unknown unknowns. The failure you have never seen before will not match any threshold you wrote. A trained model catches it because it does not match normal – even if the exact failure mode is novel.
This is why every major incident postmortem in the industry eventually includes “we did not have alerts on the right thing.” Threshold-based monitoring misses the right thing more often than people admit.
Real Tools That Do This Today
You do not have to build anything from scratch. The ecosystem is mature.
Open source:
- Prometheus + Grafana + Loki + ML plugins. The classic observability stack now has anomaly detection plugins. Grafana’s machine learning features can train on your existing time-series data.
- Elastic Stack with Machine Learning. Elasticsearch’s ML features can detect anomalies in logs and metrics out of the box. Free for self-hosted.
- Apache SkyWalking. AI-assisted root cause analysis for distributed systems.
- Netdata + anomaly detection. Lightweight agent with built-in ML for per-host metrics.
Commercial:
- Datadog Watchdog. Their AI surface alerts on anomalies across all metrics and logs. Strong for medium-to-large teams.
- New Relic AI. Similar story, with strong application performance monitoring integration.
- Dynatrace Davis. The most sophisticated AI engine in this space. Also the most expensive.
- Grafana Cloud + Managed Prometheus. Hosted Grafana now includes ML features without self-hosting complexity.
DIY:
- Python script that pulls metrics from Prometheus, runs them through scikit-learn or PyOD (anomaly detection library), fires alerts via Slack or PagerDuty when anomaly score exceeds threshold. About 200 lines of code.
Pick based on team size and budget. The open source path is genuinely viable for small teams.
How to Set Up AI Monitoring
Step 1: Get a Baseline
Before any AI can learn what is normal, you need historical data. Run Prometheus or a similar tool for at least two weeks before turning on anomaly detection. Less than that and the model has not seen enough variety.
Step 2: Train a Model
Pick one metric to start. CPU utilization on your application server is the easiest because it varies a lot naturally. Train an isolation forest or autoencoder on the past 14 days.
import pandas as pd
from sklearn.ensemble import IsolationForest
from prometheus_api_client import PrometheusConnect

prom = PrometheusConnect(url="http://localhost:9090")
metric = prom.get_metric_measurement_dataframe(
    "node_cpu_seconds_total",
    start_time="14d",
    chunk_size="1h"
)

model = IsolationForest(contamination=0.05)
model.fit(metric["value"].values.reshape(-1, 1))

# Score new data points
recent = prom.get_metric_measurement_dataframe(
    "node_cpu_seconds_total",
    start_time="1h",
    chunk_size="5m"
)
recent["anomaly_score"] = model.decision_function(
    recent["value"].values.reshape(-1, 1)
)
recent["is_anomaly"] = model.predict(
    recent["value"].values.reshape(-1, 1)
) == -1
Step 3: Wire Up Alerts
When is_anomaly is True, send a Slack notification or trigger PagerDuty. Start with low-severity channels. You will get false positives at first – that is fine, you tune as you go.
import requests

anomalies = recent[recent["is_anomaly"]]
if len(anomalies) > 0:
    requests.post("https://hooks.slack.com/services/YOUR/WEBHOOK", json={
        "text": f"⚠️  CPU anomaly detected at {anomalies.index[-1]}. Value: {anomalies['value'].iloc[-1]}%"
    })
Step 4: Validate
Before you trust it, manually check the last week of alerts against your own judgment. Did the model catch things you would have caught? Did it miss obvious issues? Did it over-fire on things that were fine? Most teams need 2 to 4 weeks of tuning before the signal-to-noise ratio is good.
Auto-Healing Patterns That Actually Work
Once you can detect problems reliably, you can fix the safe ones automatically. Start here.
Service restart. When a process becomes unresponsive, restart it. The risk is low for most stateless services. The payoff is high because the failure mode is so common.
Cache clear. When application response times spike and memory is high, flush the cache. Many “outages” are just stale caches. Zero risk for read-through caches.
Replica scale-out. When a single instance is saturated, spin up another behind the load balancer. Most cloud providers and Kubernetes make this trivial.
DNS failover. When a region is unhealthy, shift traffic to the backup region. Use health checks that actually reflect application health, not just port 80.
Disk cleanup. When disk usage crosses 90 percent, run your cleanup job automatically. Most teams have this as a cron already, but AI monitoring tells you when to trigger it early.
What you should NOT auto-heal: database schema changes, anything that touches money, anything irreversible without a rollback path, anything that has not happened at least 10 times before.
The general rule: if you have paged yourself for the same problem five times in the last six months, that is a candidate for automation. If it has happened once, leave it manual.
When It Matters Most
AI monitoring helps everywhere but it pays off most in these scenarios.
Spiky or unpredictable traffic. E-commerce sites, news sites, anything with launch-day spikes. Static thresholds are useless here.
Large microservices deployments. When you have 50 services and alerts firing from each, humans cannot keep up. AI correlates them into single incidents.
Slow-burning issues. Memory leaks that take a week to manifest. Disk slowly filling. TLS certificates about to expire. These slip past threshold-based monitoring but pattern detection catches the trend.
Off-hours coverage. Small teams without 24/7 on-call. Auto-healing the safe problems means you actually sleep through the night.
Compliance-heavy environments. When you need audit trails and detailed incident response, AI monitoring generates the data automatically.
For a static blog with 200 visitors a day, this is overkill. For anything running production traffic, it pays for itself the first time it catches a real problem at 3 AM that you would have slept through.
What You Can Do Today
You do not need a six-month project. Start here.
Step 1: Pick one metric. CPU on your app server, request latency, error rate. Just one. Get a baseline.
Step 2: Run it through an anomaly detector. Grafana ML, Elastic ML, or a 50-line Python script. Train on two weeks of historical data.
Step 3: Wire up one alert. Slack channel or PagerDuty low-priority. Watch for false positives.
Step 4: After two weeks of tuning, automate one fix. The most common failure you have. Service restart. Cache clear. Disk cleanup.
Step 5: Add a second metric. Repeat.
If you host with InterServer, their slice-based VPS line and cloud VPS options give you clean metrics endpoints for Prometheus to scrape, and their API supports automated actions like restart-on-alert if you want to wire it up. Multi-region deployments also let you write a simple auto-healing script that fails over to a backup region when latency exceeds a learned baseline.
That is the entire path. No AI team. No GPU cluster. No six-figure vendor. Just one metric, one model, one alert, one fix.
Conclusion
AI monitoring is what monitoring should have been all along. Static thresholds were a 2010 solution to a 2020 problem. They miss the things that matter and fire on the things that do not.
You do not need to boil the ocean. Pick one metric. Detect one anomaly. Auto-heal one failure. That is enough to catch more real issues than your current setup, and it scales from there.
The teams that adopt this first will not be the ones with the biggest budgets. They will be the ones willing to spend a weekend on it. The tooling is free. The data is yours. The payoff compounds – every metric you add makes the rest smarter.
For now, the barrier to entry is roughly two hundred lines of Python and two weeks of patience. Lower than it has ever been. There is no good reason to keep paging yourself for problems an algorithm could fix.
Related guides
How to Secure the Ollama API with Nginx
Protect a private Ollama API with Nginx authentication and restricted routes. Verify allowed requests, denied management calls and direct-port isolation.
AIHow to Set Up an LLM Gateway with LiteLLM
Configure a LiteLLM gateway with private administration, virtual keys and model restrictions. Test allowed requests and understand budget limitations.
AIHow to Self-Host Karakeep with AI Tagging on a VPS
Self-host Karakeep with local Ollama tagging. Restrict first-user setup, disable public registration and verify collection, search and suggested tags.
AIHow to Categorize Support Tickets with a Local AI Model
Suggest support-ticket categories from a CSV using a CPU-only AI model. Keep inference local, preserve ticket IDs, and review uncertain classifications.