
GICT knowledge base
Understanding Load Average in Linux: How to Calculate CPU Usage on Multi Core Server
Published
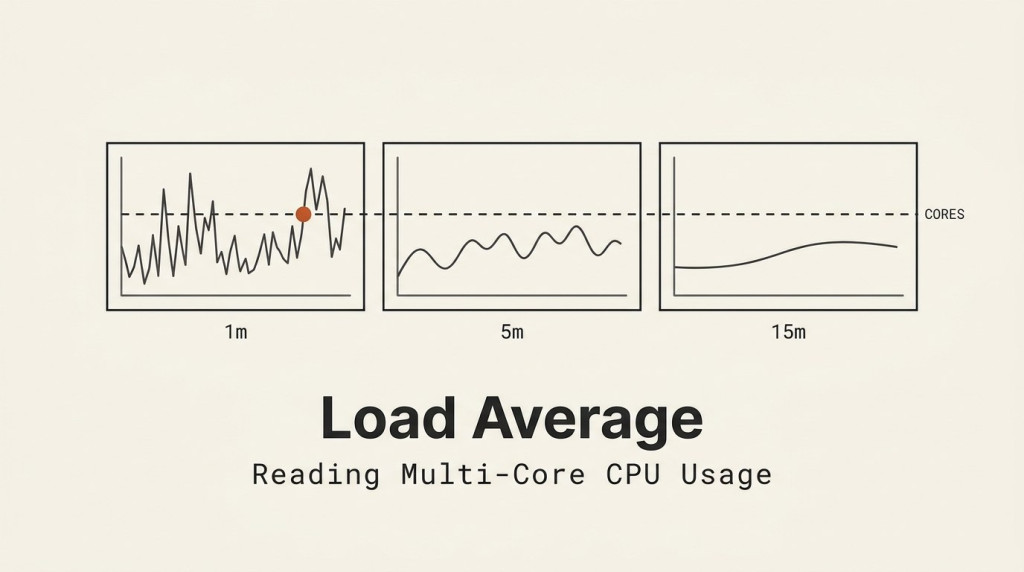
Run uptime. It shows a number like 0.24. The number means something concrete: the average count of processes that were waiting for CPU time during the last minute, 5 minutes and 15 minutes.
Load average is not percent CPU usage. It is not memory usage. It is the number of processes in the run queue, averaged over time. A process enters the run queue when it is ready to use a CPU but cannot because all CPUs are busy. If you have 4 cores and 3 processes are each waiting for CPU time, the load average is 3.00.
The Three Numbers
uptime shows three values:
uptime
22:52:39 up 57 days, 6:32, 0 users, load average: 0.24, 0.20, 0.18
The three numbers are the load averages for the last 1, 5, and 15 minutes. This server’s load is 0.24 over the last minute, 0.20 over the last 5 minutes, and 0.18 over the last 15 minutes. The trend is slightly upward, which could mean a job started recently.
The load average is the exponential moving average of the run queue length. It smooths short spikes so you do not react to a single brief burst. The 15-minute average is the slowest to change and represents the baseline.
Read the Number Against Your Core Count
The load average means nothing without knowing how many cores you have. This server has 2 cores:
nproc
Output is 2. A load average of 0.24 on 2 cores means the server is lightly loaded. Almost all the time, both cores are idle or only one is in use. A load average of 1.90 on 2 cores means processes are queuing up. At 2.00, every core has exactly one process running and any additional process waits.
Compare load average to core count as a ratio. Below 1.00 per core means no waiting. Above 1.00 per core means queueing. Above 2.00 per core on a 2-core system means serious contention.
# The load average in context
echo "Load: $(cat /proc/loadavg | awk '{print $1}') on $(nproc) cores"
# On this VPS: Load: 0.28 on 2 cores (ratio = 0.14 per core, very light)
Where the Number Comes From
The kernel updates /proc/loadavg every 5 seconds:
cat /proc/loadavg
0.24 0.20 0.18 1/527 1998299
Fields: 1-minute load, 5-minute load, 15-minute load, running/total processes, newest PID. The 1/527 means 1 process is currently running (on the CPU) and 527 total processes exist. The 1998299 is the highest PID the system has assigned, showing how many processes have been created since boot.
How Load Average Relates to CPU
High load average with low CPU usage means processes are waiting on something other than CPU. Common causes:
- Disk I/O: processes blocked waiting for reads or writes
- Network I/O: processes blocked waiting for a slow remote server
- Swap: anonymous memory pages being swapped in or out
High load average with high CPU usage means the system is compute-bound. Multiple processes are competing for CPU time.
Use top to break it down. Press 1 to see per-CPU usage. If CPU usage is 100% across all cores and load average is above your core count, the system is CPU-saturated. If CPU usage is low but load average is high, something is blocking the run queue.
A Practical Rule
Use this to assess system load at a glance:
uptime && echo "Cores: $(nproc)" && echo "Load per core: $(cat /proc/loadavg | awk '{print $1}') / $(nproc)"
A ratio below 0.7 per core means the system has headroom. A ratio between 0.7 and 1.0 means the system is busy but not saturated. Above 1.0 per core means processes are queuing and response times will degrade.
On this 2-core VPS, the current load of 0.24 gives a ratio of 0.12 per core. The system is idle most of the time. If a job kicks off and pushes the load to 2.00, that is the signal to check what is running before it saturates the cores.
Related guides
How to Set Up zram on a Small VPS
Configure zram on Ubuntu with kernel and swap checks. Understand compressed memory limits, monitor real use and avoid unsafe swap-file changes.
LinuxHow to Find Services That Need a Restart After Updates with needrestart
Find services using outdated libraries with needrestart on Ubuntu. Read restart reports, review automatic restart policy and plan maintenance safely.
LinuxHow to Limit a Linux Service’s Memory with systemd
Limit a Linux service with systemd MemoryHigh, MemoryMax and swap controls. Check cgroup support, diagnose pressure and remove only your own policy.
LinuxHow to Protect SSH with CrowdSec on Ubuntu
Protect SSH with CrowdSec on Ubuntu. Connect log detection to firewall enforcement and test temporary blocking without losing administrator access.